syn1 antibody Search Results


94
Miltenyi Biotec anti mouse cd138 pevio770
Anti Mouse Cd138 Pevio770, supplied by Miltenyi Biotec, used in various techniques. Bioz Stars score: 94/100, based on 1 PubMed citations. ZERO BIAS - scores, article reviews, protocol conditions and more
https://www.bioz.com/result/anti mouse cd138 pevio770/product/Miltenyi Biotec
Average 94 stars, based on 1 article reviews
anti mouse cd138 pevio770 - by Bioz Stars, 2026-03
94/100 stars
  Buy from Supplier

91
Alomone Labs anti synapsin
(A) Examples of VE-2A, VE-2B, VE-2BΔ7, and VE three hours after exit from the ER immunostained <t>for</t> <t>SAP102</t> (red), and synaptophysin (Sp; pseudocolored blue), and merged. VE-2B, and VE-2BΔ7 demonstrate significant clustering compared to VE (quantified in E), and targeting to synaptophysin (quantified in D). (B) Higher magnifications of clusters from VE-2B and VE-2BΔ7 seen in A (indicated by boxes) demonstrate roughly equivalent colocalization to SAP102 (quantified in C) and synaptophysin (quantified in D; scale bars 1 µm). (C) VE-2B and VE-2BΔ7 co-localized with postsynaptic SAP102 at 2X background (52–255 inclusive gray scale). By one way Anova (P<0.01) there was a significant group difference. Using Tukey’s post hoc pairwise comparisons, both VE-2B and VE-2BΔ7 pixel overlap with SAP102 was significantly greater than VE (p<0.05), however VE-2B and VE-2BΔ7 were not significantly different than eachother. This relationship between VE-2B and VE-2BΔ7 overlap with SAP102 was only obtained when analyzing pixel overlap at 2X background. (D) The percent of overlap of VE-2B, and VE-2BΔ7 with synaptophysin was significantly greater than VE (one-way Anova with post hoc pairwise comparisons to VE * p<0.05). Surprisingly, VE-2A was not significantly different than VE among the 4 groups in a post hoc comparison. VE-2B targeted to synaptophysin significantly better than VE-2A (** p<0.05) but no differently than VE-2BΔ7. These relative differences were the same regardless of the green or blue threshold. The same results were obtained at this time point after ER release using <t>synapsin</t> as the presynaptic marker (data not shown). (E) Clustering was measured using Zeiss LSM510 image analysis software. Average intensity was calculated from each intensity graph of 20–30 dendrites for a total of 839.5 µm (VE-2B), 750.4 µm (VE-2BΔ7), and 776.0 µm (VE). A cluster was defined as being more than twice the average intensity of each dendrite for equal to or greater than 0.4 µm. The average number of clusters per µm ± SEM is plotted in E. There was a significant effect of group by one-way Anova. Post hoc comparisons indicated Both VE-2B and VE-2BΔ7 showed significantly more clustering than VE (p<0.05), and were not significantly different from each other. (F) Examples of immunogold labeling with i14 α-VSVG antibody (10 nm; arrowheads) and α-NR2A/B antibody (5 nm; arrows) indicate localization of VE-2B at synapses 3 hours after release from the ER (pre, presynaptic terminal; post, postsynaptic process). Scale bar is 100 nm. Quantification of 10 nm gold indicated that 10 of 47 synapses were labeled within 0–100 nm, and 18 of 47 (38.3%) synapses showed immunogold labeling within 0–500 nm of the postsynaptic density.
Anti Synapsin, supplied by Alomone Labs, used in various techniques. Bioz Stars score: 91/100, based on 1 PubMed citations. ZERO BIAS - scores, article reviews, protocol conditions and more
https://www.bioz.com/result/anti synapsin/product/Alomone Labs
Average 91 stars, based on 1 article reviews
anti synapsin - by Bioz Stars, 2026-03
91/100 stars
  Buy from Supplier

95
Proteintech rabbit anti syn1
(A) Examples of VE-2A, VE-2B, VE-2BΔ7, and VE three hours after exit from the ER immunostained <t>for</t> <t>SAP102</t> (red), and synaptophysin (Sp; pseudocolored blue), and merged. VE-2B, and VE-2BΔ7 demonstrate significant clustering compared to VE (quantified in E), and targeting to synaptophysin (quantified in D). (B) Higher magnifications of clusters from VE-2B and VE-2BΔ7 seen in A (indicated by boxes) demonstrate roughly equivalent colocalization to SAP102 (quantified in C) and synaptophysin (quantified in D; scale bars 1 µm). (C) VE-2B and VE-2BΔ7 co-localized with postsynaptic SAP102 at 2X background (52–255 inclusive gray scale). By one way Anova (P<0.01) there was a significant group difference. Using Tukey’s post hoc pairwise comparisons, both VE-2B and VE-2BΔ7 pixel overlap with SAP102 was significantly greater than VE (p<0.05), however VE-2B and VE-2BΔ7 were not significantly different than eachother. This relationship between VE-2B and VE-2BΔ7 overlap with SAP102 was only obtained when analyzing pixel overlap at 2X background. (D) The percent of overlap of VE-2B, and VE-2BΔ7 with synaptophysin was significantly greater than VE (one-way Anova with post hoc pairwise comparisons to VE * p<0.05). Surprisingly, VE-2A was not significantly different than VE among the 4 groups in a post hoc comparison. VE-2B targeted to synaptophysin significantly better than VE-2A (** p<0.05) but no differently than VE-2BΔ7. These relative differences were the same regardless of the green or blue threshold. The same results were obtained at this time point after ER release using <t>synapsin</t> as the presynaptic marker (data not shown). (E) Clustering was measured using Zeiss LSM510 image analysis software. Average intensity was calculated from each intensity graph of 20–30 dendrites for a total of 839.5 µm (VE-2B), 750.4 µm (VE-2BΔ7), and 776.0 µm (VE). A cluster was defined as being more than twice the average intensity of each dendrite for equal to or greater than 0.4 µm. The average number of clusters per µm ± SEM is plotted in E. There was a significant effect of group by one-way Anova. Post hoc comparisons indicated Both VE-2B and VE-2BΔ7 showed significantly more clustering than VE (p<0.05), and were not significantly different from each other. (F) Examples of immunogold labeling with i14 α-VSVG antibody (10 nm; arrowheads) and α-NR2A/B antibody (5 nm; arrows) indicate localization of VE-2B at synapses 3 hours after release from the ER (pre, presynaptic terminal; post, postsynaptic process). Scale bar is 100 nm. Quantification of 10 nm gold indicated that 10 of 47 synapses were labeled within 0–100 nm, and 18 of 47 (38.3%) synapses showed immunogold labeling within 0–500 nm of the postsynaptic density.
Rabbit Anti Syn1, supplied by Proteintech, used in various techniques. Bioz Stars score: 95/100, based on 1 PubMed citations. ZERO BIAS - scores, article reviews, protocol conditions and more
https://www.bioz.com/result/rabbit anti syn1/product/Proteintech
Average 95 stars, based on 1 article reviews
rabbit anti syn1 - by Bioz Stars, 2026-03
95/100 stars
  Buy from Supplier

94
Miltenyi Biotec cd138 apc rea104
(A) Examples of VE-2A, VE-2B, VE-2BΔ7, and VE three hours after exit from the ER immunostained <t>for</t> <t>SAP102</t> (red), and synaptophysin (Sp; pseudocolored blue), and merged. VE-2B, and VE-2BΔ7 demonstrate significant clustering compared to VE (quantified in E), and targeting to synaptophysin (quantified in D). (B) Higher magnifications of clusters from VE-2B and VE-2BΔ7 seen in A (indicated by boxes) demonstrate roughly equivalent colocalization to SAP102 (quantified in C) and synaptophysin (quantified in D; scale bars 1 µm). (C) VE-2B and VE-2BΔ7 co-localized with postsynaptic SAP102 at 2X background (52–255 inclusive gray scale). By one way Anova (P<0.01) there was a significant group difference. Using Tukey’s post hoc pairwise comparisons, both VE-2B and VE-2BΔ7 pixel overlap with SAP102 was significantly greater than VE (p<0.05), however VE-2B and VE-2BΔ7 were not significantly different than eachother. This relationship between VE-2B and VE-2BΔ7 overlap with SAP102 was only obtained when analyzing pixel overlap at 2X background. (D) The percent of overlap of VE-2B, and VE-2BΔ7 with synaptophysin was significantly greater than VE (one-way Anova with post hoc pairwise comparisons to VE * p<0.05). Surprisingly, VE-2A was not significantly different than VE among the 4 groups in a post hoc comparison. VE-2B targeted to synaptophysin significantly better than VE-2A (** p<0.05) but no differently than VE-2BΔ7. These relative differences were the same regardless of the green or blue threshold. The same results were obtained at this time point after ER release using <t>synapsin</t> as the presynaptic marker (data not shown). (E) Clustering was measured using Zeiss LSM510 image analysis software. Average intensity was calculated from each intensity graph of 20–30 dendrites for a total of 839.5 µm (VE-2B), 750.4 µm (VE-2BΔ7), and 776.0 µm (VE). A cluster was defined as being more than twice the average intensity of each dendrite for equal to or greater than 0.4 µm. The average number of clusters per µm ± SEM is plotted in E. There was a significant effect of group by one-way Anova. Post hoc comparisons indicated Both VE-2B and VE-2BΔ7 showed significantly more clustering than VE (p<0.05), and were not significantly different from each other. (F) Examples of immunogold labeling with i14 α-VSVG antibody (10 nm; arrowheads) and α-NR2A/B antibody (5 nm; arrows) indicate localization of VE-2B at synapses 3 hours after release from the ER (pre, presynaptic terminal; post, postsynaptic process). Scale bar is 100 nm. Quantification of 10 nm gold indicated that 10 of 47 synapses were labeled within 0–100 nm, and 18 of 47 (38.3%) synapses showed immunogold labeling within 0–500 nm of the postsynaptic density.
Cd138 Apc Rea104, supplied by Miltenyi Biotec, used in various techniques. Bioz Stars score: 94/100, based on 1 PubMed citations. ZERO BIAS - scores, article reviews, protocol conditions and more
https://www.bioz.com/result/cd138 apc rea104/product/Miltenyi Biotec
Average 94 stars, based on 1 article reviews
cd138 apc rea104 - by Bioz Stars, 2026-03
94/100 stars
  Buy from Supplier

94
Miltenyi Biotec cd138 pe
(A) Examples of VE-2A, VE-2B, VE-2BΔ7, and VE three hours after exit from the ER immunostained <t>for</t> <t>SAP102</t> (red), and synaptophysin (Sp; pseudocolored blue), and merged. VE-2B, and VE-2BΔ7 demonstrate significant clustering compared to VE (quantified in E), and targeting to synaptophysin (quantified in D). (B) Higher magnifications of clusters from VE-2B and VE-2BΔ7 seen in A (indicated by boxes) demonstrate roughly equivalent colocalization to SAP102 (quantified in C) and synaptophysin (quantified in D; scale bars 1 µm). (C) VE-2B and VE-2BΔ7 co-localized with postsynaptic SAP102 at 2X background (52–255 inclusive gray scale). By one way Anova (P<0.01) there was a significant group difference. Using Tukey’s post hoc pairwise comparisons, both VE-2B and VE-2BΔ7 pixel overlap with SAP102 was significantly greater than VE (p<0.05), however VE-2B and VE-2BΔ7 were not significantly different than eachother. This relationship between VE-2B and VE-2BΔ7 overlap with SAP102 was only obtained when analyzing pixel overlap at 2X background. (D) The percent of overlap of VE-2B, and VE-2BΔ7 with synaptophysin was significantly greater than VE (one-way Anova with post hoc pairwise comparisons to VE * p<0.05). Surprisingly, VE-2A was not significantly different than VE among the 4 groups in a post hoc comparison. VE-2B targeted to synaptophysin significantly better than VE-2A (** p<0.05) but no differently than VE-2BΔ7. These relative differences were the same regardless of the green or blue threshold. The same results were obtained at this time point after ER release using <t>synapsin</t> as the presynaptic marker (data not shown). (E) Clustering was measured using Zeiss LSM510 image analysis software. Average intensity was calculated from each intensity graph of 20–30 dendrites for a total of 839.5 µm (VE-2B), 750.4 µm (VE-2BΔ7), and 776.0 µm (VE). A cluster was defined as being more than twice the average intensity of each dendrite for equal to or greater than 0.4 µm. The average number of clusters per µm ± SEM is plotted in E. There was a significant effect of group by one-way Anova. Post hoc comparisons indicated Both VE-2B and VE-2BΔ7 showed significantly more clustering than VE (p<0.05), and were not significantly different from each other. (F) Examples of immunogold labeling with i14 α-VSVG antibody (10 nm; arrowheads) and α-NR2A/B antibody (5 nm; arrows) indicate localization of VE-2B at synapses 3 hours after release from the ER (pre, presynaptic terminal; post, postsynaptic process). Scale bar is 100 nm. Quantification of 10 nm gold indicated that 10 of 47 synapses were labeled within 0–100 nm, and 18 of 47 (38.3%) synapses showed immunogold labeling within 0–500 nm of the postsynaptic density.
Cd138 Pe, supplied by Miltenyi Biotec, used in various techniques. Bioz Stars score: 94/100, based on 1 PubMed citations. ZERO BIAS - scores, article reviews, protocol conditions and more
https://www.bioz.com/result/cd138 pe/product/Miltenyi Biotec
Average 94 stars, based on 1 article reviews
cd138 pe - by Bioz Stars, 2026-03
94/100 stars
  Buy from Supplier

94
Miltenyi Biotec cd138 pe vio615
a. Spleen weight of wild-type (WT) and Ftx KO females at 3-months, 1-year and 2-years of age. Median values are shown. ( t-test , * p -values < 0.05). Underneath, representative images of WT and Ftx KO spleens from 3-month, 1-year and 2-year-old females. b. Representative images of hematoxylin-eosin staining on sections of spleens from 1-year-old WT and Ftx KO females. Scale bar; 100 μm. c. Representative flow cytometry analysis of splenic myeloid dendritic cells (m-DC) in WT and Ftx KO 1-year-old females. On the right, percentages of splenic m-DC (CD11b + CD11c + ) and splenic plasmacytoid dendritic cells (p-DC) (CD11c + B220 + SiglecH + ) in leucocytes. Each triangle represents a mouse. Median values are shown. ( t-test , * p -values < 0.05). d. Representative flow cytometry analysis of spontaneously activated B cells (B220 + CD69 + ) (upper panels) or of spontaneously activated T cells (CD4 + CD69 + ) (lower panels) in spleen from 1-year-old WT and Ftx KO females. Percentages in leucocytes are shown on the graphs beneath. Each triangle represents a mouse. Median values are shown. ( t-test , * p -values < 0.05). e. IgG2a natural antibody levels in sera of 1-year- and 2-year-old WT or Ftx KO females measured by ELISA. Each triangle represents a mouse. Median values are shown. ( t-test , * p -values < 0.05). f. Representative flow cytometry analysis of (B220 + <t>CD138</t> + ) plasma cells in the spleen of 1-year-old WT and Ftx KO females. Percentages in leucocytes are shown on the graphs beneath. Each triangle represents a mouse. Median values are shown. ( t-test , * p -values < 0.05). g. Representative flow cytometry analysis of (CD19 + B220 lo CD5 + ) natural antibody producing B1a in the peritoneal cavity (PerC) of 1-year-old WT and Ftx KO females. Percentages in leucocytes are shown on the graphs beneath. Each triangle represents a mouse. Median values are shown. ( t-test , * p -values < 0.05). h. Cytokines levels in the blood analysed with CBA assays on sera from 3-month-, 1-year-, or 2-year-old WT and Ftx KO females. Each triangle represents a mouse. Median values are shown. ( t-test , * p -values < 0.05). i. Representative flow cytometry analysis of monocyte populations including non-classical (CD11b hi CD43 lo Ly6C + ) scavenger monocytes in the spleen of 1-year-old WT and Ftx KO females. Percentages in leucocytes are shown on the graphs beneath. Each triangle represents a mouse. Median values are shown. ( t-test , * p -values < 0.05).
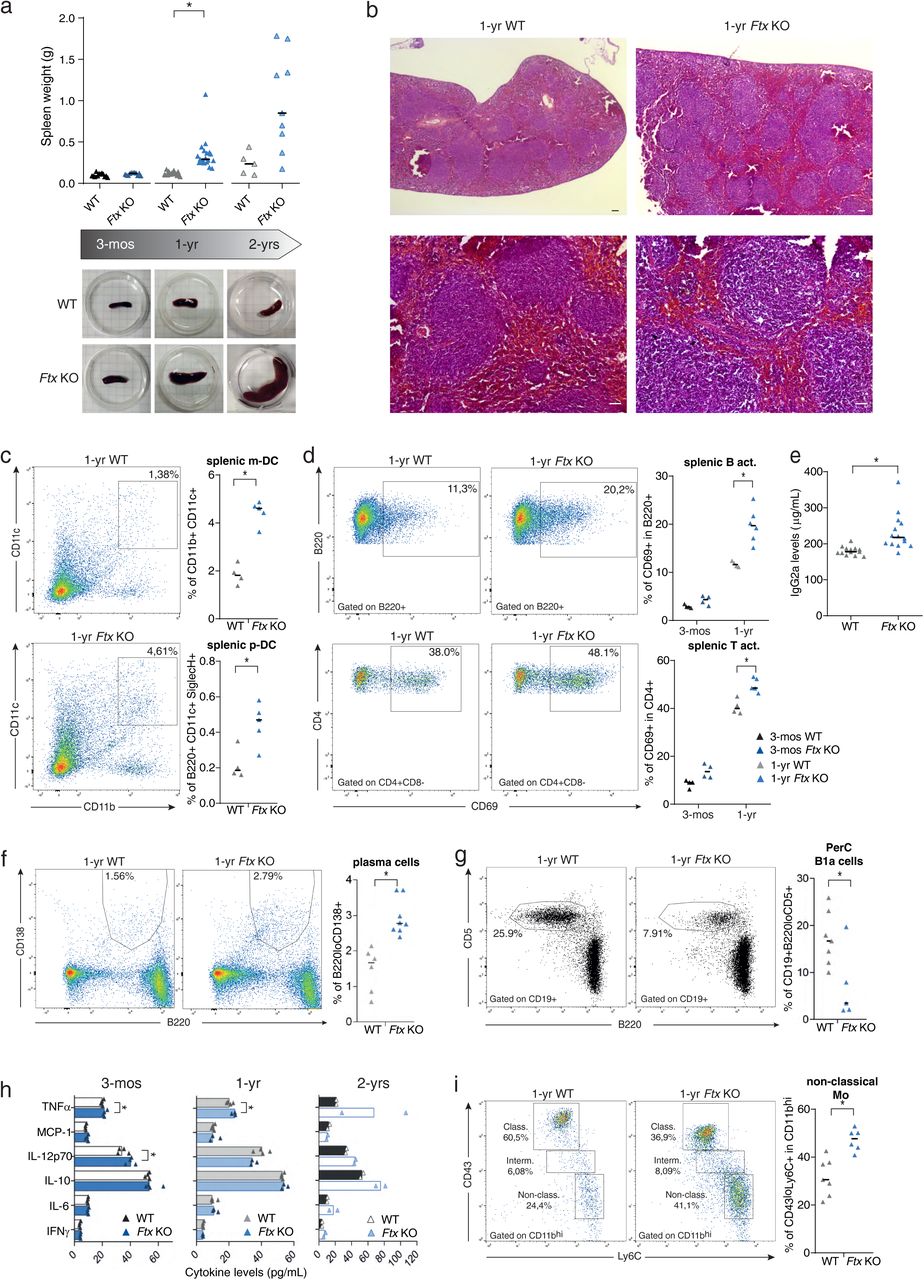
Cd138 Pe Vio615, supplied by Miltenyi Biotec, used in various techniques. Bioz Stars score: 94/100, based on 1 PubMed citations. ZERO BIAS - scores, article reviews, protocol conditions and more
https://www.bioz.com/result/cd138 pe vio615/product/Miltenyi Biotec
Average 94 stars, based on 1 article reviews
cd138 pe vio615 - by Bioz Stars, 2026-03
94/100 stars
  Buy from Supplier

93
Boster Bio syn1
Figure 2. DM mice exhibit synaptic deficits and increased neuroinflammation in the HIP. (A) Repre- sentative WB images showing the expression levels of the presynaptic protein synapsin I <t>(SYN1)</t> and the postsynaptic protein postsynaptic density protein 95 (PSD95) in the HIP of CTL and DM mice. β-actin was used as an internal control. (B) Semi-quantitative analysis of PSD95 and <t>SYN1</t> expression levels from immunoblot experiments. n = 6. (C) Representative images of Iba1 immunostaining in the HIP of CTL and DM mice. The area within the dashed box is magnified and displayed in the insets. Scale bars: 100 µm (main images) and 20 µm (insets). (D) Quantitative analysis of Iba1-positive microglia in the HIP of CTL and DM mice. n = 5. (E) qPCR analysis of iNOS and Arg1 mRNA levels in the HIP of CTL and DM mice. n = 6. (F) qPCR analysis of IL-6, IL-1β, and TNF-α mRNA levels in the HIP of CTL and DM mice. n = 6. (G) ELISA measuring IL-6, IL-1β, and TNF-α levels in the serum of CTL and DM mice. n = 3. Data are presented as mean ± SEM. Statistical significance was determined using a one-tailed unpaired t-test. * p < 0.05, ** p < 0.01, *** p < 0.001.
Syn1, supplied by Boster Bio, used in various techniques. Bioz Stars score: 93/100, based on 1 PubMed citations. ZERO BIAS - scores, article reviews, protocol conditions and more
https://www.bioz.com/result/syn1/product/Boster Bio
Average 93 stars, based on 1 article reviews
syn1 - by Bioz Stars, 2026-03
93/100 stars
  Buy from Supplier

90
OriGene anti synapsin phospho ser
Figure 2. DM mice exhibit synaptic deficits and increased neuroinflammation in the HIP. (A) Repre- sentative WB images showing the expression levels of the presynaptic protein synapsin I <t>(SYN1)</t> and the postsynaptic protein postsynaptic density protein 95 (PSD95) in the HIP of CTL and DM mice. β-actin was used as an internal control. (B) Semi-quantitative analysis of PSD95 and <t>SYN1</t> expression levels from immunoblot experiments. n = 6. (C) Representative images of Iba1 immunostaining in the HIP of CTL and DM mice. The area within the dashed box is magnified and displayed in the insets. Scale bars: 100 µm (main images) and 20 µm (insets). (D) Quantitative analysis of Iba1-positive microglia in the HIP of CTL and DM mice. n = 5. (E) qPCR analysis of iNOS and Arg1 mRNA levels in the HIP of CTL and DM mice. n = 6. (F) qPCR analysis of IL-6, IL-1β, and TNF-α mRNA levels in the HIP of CTL and DM mice. n = 6. (G) ELISA measuring IL-6, IL-1β, and TNF-α levels in the serum of CTL and DM mice. n = 3. Data are presented as mean ± SEM. Statistical significance was determined using a one-tailed unpaired t-test. * p < 0.05, ** p < 0.01, *** p < 0.001.
Anti Synapsin Phospho Ser, supplied by OriGene, used in various techniques. Bioz Stars score: 90/100, based on 1 PubMed citations. ZERO BIAS - scores, article reviews, protocol conditions and more
https://www.bioz.com/result/anti synapsin phospho ser/product/OriGene
Average 90 stars, based on 1 article reviews
anti synapsin phospho ser - by Bioz Stars, 2026-03
90/100 stars
  Buy from Supplier

94
Biosynth Carbosynth adx β syn1
Fig. 1 Schematic representation of synuclein proteins (α, β, and γ-synuclein) illustrating their conserved and unique epitopes. The lower panel shows the results of the β-syn-targeting ELISAs: N-terminus assay (using an EP1537Y antibody for detection and N-terminus capture), mid-region assay (utilizing EP1537Y and ADx <t>β-syn1</t> antibodies), and C-terminus assay (using EP1537Y for detection of ADx β-syn2 for capture). The placement of antibodies reflects their approximate binding sites on the β-syn protein. These in-house β-syn-specific assays offer targeted epitope recognition, enhancing the specificity of synaptic degeneration biomarker detection in AD. The exact binding epitopes of the antibodies are listed in the figure, starting with the first amino acid binding position and ending with the last amino acid
Adx β Syn1, supplied by Biosynth Carbosynth, used in various techniques. Bioz Stars score: 94/100, based on 1 PubMed citations. ZERO BIAS - scores, article reviews, protocol conditions and more
https://www.bioz.com/result/adx β syn1/product/Biosynth Carbosynth
Average 94 stars, based on 1 article reviews
adx β syn1 - by Bioz Stars, 2026-03
94/100 stars
  Buy from Supplier

syp  (Cusabio)
92
Cusabio syp
Fig. 1 Schematic representation of synuclein proteins (α, β, and γ-synuclein) illustrating their conserved and unique epitopes. The lower panel shows the results of the β-syn-targeting ELISAs: N-terminus assay (using an EP1537Y antibody for detection and N-terminus capture), mid-region assay (utilizing EP1537Y and ADx <t>β-syn1</t> antibodies), and C-terminus assay (using EP1537Y for detection of ADx β-syn2 for capture). The placement of antibodies reflects their approximate binding sites on the β-syn protein. These in-house β-syn-specific assays offer targeted epitope recognition, enhancing the specificity of synaptic degeneration biomarker detection in AD. The exact binding epitopes of the antibodies are listed in the figure, starting with the first amino acid binding position and ending with the last amino acid
Syp, supplied by Cusabio, used in various techniques. Bioz Stars score: 92/100, based on 1 PubMed citations. ZERO BIAS - scores, article reviews, protocol conditions and more
https://www.bioz.com/result/syp/product/Cusabio
Average 92 stars, based on 1 article reviews
syp - by Bioz Stars, 2026-03
92/100 stars
  Buy from Supplier

93
Cusabio anti synapsin 1
Fig. 1 Schematic representation of synuclein proteins (α, β, and γ-synuclein) illustrating their conserved and unique epitopes. The lower panel shows the results of the β-syn-targeting ELISAs: N-terminus assay (using an EP1537Y antibody for detection and N-terminus capture), mid-region assay (utilizing EP1537Y and ADx <t>β-syn1</t> antibodies), and C-terminus assay (using EP1537Y for detection of ADx β-syn2 for capture). The placement of antibodies reflects their approximate binding sites on the β-syn protein. These in-house β-syn-specific assays offer targeted epitope recognition, enhancing the specificity of synaptic degeneration biomarker detection in AD. The exact binding epitopes of the antibodies are listed in the figure, starting with the first amino acid binding position and ending with the last amino acid
Anti Synapsin 1, supplied by Cusabio, used in various techniques. Bioz Stars score: 93/100, based on 1 PubMed citations. ZERO BIAS - scores, article reviews, protocol conditions and more
https://www.bioz.com/result/anti synapsin 1/product/Cusabio
Average 93 stars, based on 1 article reviews
anti synapsin 1 - by Bioz Stars, 2026-03
93/100 stars
  Buy from Supplier

90
Becton Dickinson mouse mab anti-α-syn syn-1
Organotypic mouse hippocampal slice cultures as a model to study seeded <t>α-syn</t> aggregation in the region between DG and CA3. a Diagram showing the synaptic connections of granule cells of DG (where S129A PFFs were injected) to pyramidal neurons in CA3 that subsequently connect to the pyramidal neurons of the CA1 region. b OHSCs from mouse pups were cultivated on an air-liquid interface. c Progressive accumulation of total ( i ) and pS129-α-syn ( ii , 11A5) in cultures from wild type mouse pups after 0, 7, 14, and 21 DIV analyzed by immunoblotting. d Experimental flow showing time of PFF microinjection at 7 DIV and tissue collection for analysis at 3, 5, 7, and 14 dpi. e pS129-positive α-syn structures (D1R1R) imaged at DG, following PFF injection at DG. Aggregates are first recognizable at 3 dpi as short serpentine aggregates ( i ) that coalesce into longer aggregates by 5 dpi ( ii ) and at 7 dpi occur as fibrillar aggregates around neuronal nuclei ( iii ). Scale bars: 20 μm. f MJF-14-positive serpentine aggregates co-localize with the axonal marker neurofilament light chain (NF-L). Scale bar: 20 μm. g pS129-positive cell body inclusions (D1R1R) are located in NeuN-positive neurons. Scale bar: 20 μm, inset: 5 μm. h Thread-like cell body inclusion detected by MJF-14 and reconstructed in 3D by IMARIS software. i Cell body pS129 α-syn pathology (D1R1R) in the hindbrain of end-stage h-A53T-α-syn transgenic mice (M83) resembles inclusions in the slice model (panels e,iii & g ). j dSTORM image reconstruction of pS129-positive axonal processes (D1R1R) within the OHSC. Scale bar: 1 μm. k Progressive accumulation of insoluble pS129-positive mouse α-syn (11A5) in PFF-injected slices. Western blots in c & k are representative of 2–3 separate experiments. Images in e are examples from 2 to 6 individual experiments with 9–17 slices in total. Images in f & g are representative of 4–5 experiments/15–16 slices in total
Mouse Mab Anti α Syn Syn 1, supplied by Becton Dickinson, used in various techniques. Bioz Stars score: 90/100, based on 1 PubMed citations. ZERO BIAS - scores, article reviews, protocol conditions and more
https://www.bioz.com/result/mouse mab anti-α-syn syn-1/product/Becton Dickinson
Average 90 stars, based on 1 article reviews
mouse mab anti-α-syn syn-1 - by Bioz Stars, 2026-03
90/100 stars
  Buy from Supplier

Image Search Results


(A) Examples of VE-2A, VE-2B, VE-2BΔ7, and VE three hours after exit from the ER immunostained for SAP102 (red), and synaptophysin (Sp; pseudocolored blue), and merged. VE-2B, and VE-2BΔ7 demonstrate significant clustering compared to VE (quantified in E), and targeting to synaptophysin (quantified in D). (B) Higher magnifications of clusters from VE-2B and VE-2BΔ7 seen in A (indicated by boxes) demonstrate roughly equivalent colocalization to SAP102 (quantified in C) and synaptophysin (quantified in D; scale bars 1 µm). (C) VE-2B and VE-2BΔ7 co-localized with postsynaptic SAP102 at 2X background (52–255 inclusive gray scale). By one way Anova (P<0.01) there was a significant group difference. Using Tukey’s post hoc pairwise comparisons, both VE-2B and VE-2BΔ7 pixel overlap with SAP102 was significantly greater than VE (p<0.05), however VE-2B and VE-2BΔ7 were not significantly different than eachother. This relationship between VE-2B and VE-2BΔ7 overlap with SAP102 was only obtained when analyzing pixel overlap at 2X background. (D) The percent of overlap of VE-2B, and VE-2BΔ7 with synaptophysin was significantly greater than VE (one-way Anova with post hoc pairwise comparisons to VE * p<0.05). Surprisingly, VE-2A was not significantly different than VE among the 4 groups in a post hoc comparison. VE-2B targeted to synaptophysin significantly better than VE-2A (** p<0.05) but no differently than VE-2BΔ7. These relative differences were the same regardless of the green or blue threshold. The same results were obtained at this time point after ER release using synapsin as the presynaptic marker (data not shown). (E) Clustering was measured using Zeiss LSM510 image analysis software. Average intensity was calculated from each intensity graph of 20–30 dendrites for a total of 839.5 µm (VE-2B), 750.4 µm (VE-2BΔ7), and 776.0 µm (VE). A cluster was defined as being more than twice the average intensity of each dendrite for equal to or greater than 0.4 µm. The average number of clusters per µm ± SEM is plotted in E. There was a significant effect of group by one-way Anova. Post hoc comparisons indicated Both VE-2B and VE-2BΔ7 showed significantly more clustering than VE (p<0.05), and were not significantly different from each other. (F) Examples of immunogold labeling with i14 α-VSVG antibody (10 nm; arrowheads) and α-NR2A/B antibody (5 nm; arrows) indicate localization of VE-2B at synapses 3 hours after release from the ER (pre, presynaptic terminal; post, postsynaptic process). Scale bar is 100 nm. Quantification of 10 nm gold indicated that 10 of 47 synapses were labeled within 0–100 nm, and 18 of 47 (38.3%) synapses showed immunogold labeling within 0–500 nm of the postsynaptic density.

Journal: PLoS ONE

Article Title: Trafficking of the NMDAR2B Receptor Subunit Distal Cytoplasmic Tail from Endoplasmic Reticulum to the Synapse

doi: 10.1371/journal.pone.0039585

Figure Lengend Snippet: (A) Examples of VE-2A, VE-2B, VE-2BΔ7, and VE three hours after exit from the ER immunostained for SAP102 (red), and synaptophysin (Sp; pseudocolored blue), and merged. VE-2B, and VE-2BΔ7 demonstrate significant clustering compared to VE (quantified in E), and targeting to synaptophysin (quantified in D). (B) Higher magnifications of clusters from VE-2B and VE-2BΔ7 seen in A (indicated by boxes) demonstrate roughly equivalent colocalization to SAP102 (quantified in C) and synaptophysin (quantified in D; scale bars 1 µm). (C) VE-2B and VE-2BΔ7 co-localized with postsynaptic SAP102 at 2X background (52–255 inclusive gray scale). By one way Anova (P<0.01) there was a significant group difference. Using Tukey’s post hoc pairwise comparisons, both VE-2B and VE-2BΔ7 pixel overlap with SAP102 was significantly greater than VE (p<0.05), however VE-2B and VE-2BΔ7 were not significantly different than eachother. This relationship between VE-2B and VE-2BΔ7 overlap with SAP102 was only obtained when analyzing pixel overlap at 2X background. (D) The percent of overlap of VE-2B, and VE-2BΔ7 with synaptophysin was significantly greater than VE (one-way Anova with post hoc pairwise comparisons to VE * p<0.05). Surprisingly, VE-2A was not significantly different than VE among the 4 groups in a post hoc comparison. VE-2B targeted to synaptophysin significantly better than VE-2A (** p<0.05) but no differently than VE-2BΔ7. These relative differences were the same regardless of the green or blue threshold. The same results were obtained at this time point after ER release using synapsin as the presynaptic marker (data not shown). (E) Clustering was measured using Zeiss LSM510 image analysis software. Average intensity was calculated from each intensity graph of 20–30 dendrites for a total of 839.5 µm (VE-2B), 750.4 µm (VE-2BΔ7), and 776.0 µm (VE). A cluster was defined as being more than twice the average intensity of each dendrite for equal to or greater than 0.4 µm. The average number of clusters per µm ± SEM is plotted in E. There was a significant effect of group by one-way Anova. Post hoc comparisons indicated Both VE-2B and VE-2BΔ7 showed significantly more clustering than VE (p<0.05), and were not significantly different from each other. (F) Examples of immunogold labeling with i14 α-VSVG antibody (10 nm; arrowheads) and α-NR2A/B antibody (5 nm; arrows) indicate localization of VE-2B at synapses 3 hours after release from the ER (pre, presynaptic terminal; post, postsynaptic process). Scale bar is 100 nm. Quantification of 10 nm gold indicated that 10 of 47 synapses were labeled within 0–100 nm, and 18 of 47 (38.3%) synapses showed immunogold labeling within 0–500 nm of the postsynaptic density.

Article Snippet: Neurons were incubated with primary antibodies for 1 hour using the following dilutions: anti-GM130, 1∶200; anti-TGN38, 1∶200; anti-PSD-95, 1∶500 (T60); anti-PSD-95, 1∶150 (TL); anti-SAP102, 1∶500 (JH62514); anti-SAP102, 1∶200 (Alomone); anti-Synapsin, 1∶500; anti-Synaptophysin, 1∶500; anti-VSVG, 1∶3 (i1 hybridoma).

Techniques: Marker, Software, Labeling

(A) VE-2B and VE-2BΔ7 were allowed to exit the ER for 45 minutes and then immunostained for surface expression with I1 antibody and presynaptic terminals with anti-synapsin. Yellow arrows in VE-2BΔ7 indicate surface puncta not in the vicinity of synapsin (right panels). At 45 minutes after ER exit, only about 30% of VE-2B and VE-2BΔ7 puncta in dendrites showed any immunostaining with i1 antibody. (B) The VE and VE-2BΔ7 surface puncta more than 1 µm away from synapsin were significantly greater in relative number than VE-2B (left panel). The surface VE-2BΔ7 within 0.3 µm is similar to VE-2B but not significantly different from VE, while VE-2B within 0.3 µm is significantly different than VE (one-way Anova considering VE, VE-2B, and VE-2BΔ7 in the >1.0 micron bins and then in the <0.3 micron bins, then pairwise post hoc comparisons; p<0.05). Centroids and distances were calculated with images thresholded at 2X mean background. Percent pixel overlap of green puncta with synapsin in the same data set showed no difference in the total VE-2B and VE-2BΔ7 at any threshold and trended toward increased synaptic localization at 45 minutes after permissive temperature, but did not reach significance when compared to VE, as was apparent at 3 hours (one-way Anova, p = 0.11; right panel, indicated as ‘total’). Green and red images from the same data set also were merged and color-thresholded for yellow to define the surface population. Percent overlap of yellow puncta with synapsin (blue) was then assessed for VE, VE-2B, and VE-2BΔ7 (right panel, indicated as ‘surface’). VE-2BΔ7 surface pixel overlap with synapsin trended toward a decrease compared to VE-2B at 2X background but not significantly until thresholded at 3X background (one-way Anova, post hoc comparison p<0.05). (C) Model of trafficking of NR2B. NR2B forms hetero-oligomers with NR1 subunits at the level of the ER , but the NR2 distal C-terminus is necessary and sufficient to confer significant synaptic localization , . NR2A/B clusters with SAP102 early in the secretory pathway, and significantly so at the level of the cis-medial- Golgi. PSD-95 is added as part of the NR2B/NR1-SAP102 complex as soon as the TGN. NR2B/NR1-SAP102 complexes may be cotransported to the vicinity of the synapse, and also cotransported at least in-part along dendrites via Kif-17, mLin-2/Cask, mLin7, mLin10, and SAP97 in a poly-protein complex [see ] and added to postsynaptic structures. The NR2B/SAP102/PSD-95 association does not appear to be essential for immediate synaptic targeting, but is required for maintenance of position on the synaptic surface.

Journal: PLoS ONE

Article Title: Trafficking of the NMDAR2B Receptor Subunit Distal Cytoplasmic Tail from Endoplasmic Reticulum to the Synapse

doi: 10.1371/journal.pone.0039585

Figure Lengend Snippet: (A) VE-2B and VE-2BΔ7 were allowed to exit the ER for 45 minutes and then immunostained for surface expression with I1 antibody and presynaptic terminals with anti-synapsin. Yellow arrows in VE-2BΔ7 indicate surface puncta not in the vicinity of synapsin (right panels). At 45 minutes after ER exit, only about 30% of VE-2B and VE-2BΔ7 puncta in dendrites showed any immunostaining with i1 antibody. (B) The VE and VE-2BΔ7 surface puncta more than 1 µm away from synapsin were significantly greater in relative number than VE-2B (left panel). The surface VE-2BΔ7 within 0.3 µm is similar to VE-2B but not significantly different from VE, while VE-2B within 0.3 µm is significantly different than VE (one-way Anova considering VE, VE-2B, and VE-2BΔ7 in the >1.0 micron bins and then in the <0.3 micron bins, then pairwise post hoc comparisons; p<0.05). Centroids and distances were calculated with images thresholded at 2X mean background. Percent pixel overlap of green puncta with synapsin in the same data set showed no difference in the total VE-2B and VE-2BΔ7 at any threshold and trended toward increased synaptic localization at 45 minutes after permissive temperature, but did not reach significance when compared to VE, as was apparent at 3 hours (one-way Anova, p = 0.11; right panel, indicated as ‘total’). Green and red images from the same data set also were merged and color-thresholded for yellow to define the surface population. Percent overlap of yellow puncta with synapsin (blue) was then assessed for VE, VE-2B, and VE-2BΔ7 (right panel, indicated as ‘surface’). VE-2BΔ7 surface pixel overlap with synapsin trended toward a decrease compared to VE-2B at 2X background but not significantly until thresholded at 3X background (one-way Anova, post hoc comparison p<0.05). (C) Model of trafficking of NR2B. NR2B forms hetero-oligomers with NR1 subunits at the level of the ER , but the NR2 distal C-terminus is necessary and sufficient to confer significant synaptic localization , . NR2A/B clusters with SAP102 early in the secretory pathway, and significantly so at the level of the cis-medial- Golgi. PSD-95 is added as part of the NR2B/NR1-SAP102 complex as soon as the TGN. NR2B/NR1-SAP102 complexes may be cotransported to the vicinity of the synapse, and also cotransported at least in-part along dendrites via Kif-17, mLin-2/Cask, mLin7, mLin10, and SAP97 in a poly-protein complex [see ] and added to postsynaptic structures. The NR2B/SAP102/PSD-95 association does not appear to be essential for immediate synaptic targeting, but is required for maintenance of position on the synaptic surface.

Article Snippet: Neurons were incubated with primary antibodies for 1 hour using the following dilutions: anti-GM130, 1∶200; anti-TGN38, 1∶200; anti-PSD-95, 1∶500 (T60); anti-PSD-95, 1∶150 (TL); anti-SAP102, 1∶500 (JH62514); anti-SAP102, 1∶200 (Alomone); anti-Synapsin, 1∶500; anti-Synaptophysin, 1∶500; anti-VSVG, 1∶3 (i1 hybridoma).

Techniques: Expressing, Immunostaining

a. Spleen weight of wild-type (WT) and Ftx KO females at 3-months, 1-year and 2-years of age. Median values are shown. ( t-test , * p -values < 0.05). Underneath, representative images of WT and Ftx KO spleens from 3-month, 1-year and 2-year-old females. b. Representative images of hematoxylin-eosin staining on sections of spleens from 1-year-old WT and Ftx KO females. Scale bar; 100 μm. c. Representative flow cytometry analysis of splenic myeloid dendritic cells (m-DC) in WT and Ftx KO 1-year-old females. On the right, percentages of splenic m-DC (CD11b + CD11c + ) and splenic plasmacytoid dendritic cells (p-DC) (CD11c + B220 + SiglecH + ) in leucocytes. Each triangle represents a mouse. Median values are shown. ( t-test , * p -values < 0.05). d. Representative flow cytometry analysis of spontaneously activated B cells (B220 + CD69 + ) (upper panels) or of spontaneously activated T cells (CD4 + CD69 + ) (lower panels) in spleen from 1-year-old WT and Ftx KO females. Percentages in leucocytes are shown on the graphs beneath. Each triangle represents a mouse. Median values are shown. ( t-test , * p -values < 0.05). e. IgG2a natural antibody levels in sera of 1-year- and 2-year-old WT or Ftx KO females measured by ELISA. Each triangle represents a mouse. Median values are shown. ( t-test , * p -values < 0.05). f. Representative flow cytometry analysis of (B220 + CD138 + ) plasma cells in the spleen of 1-year-old WT and Ftx KO females. Percentages in leucocytes are shown on the graphs beneath. Each triangle represents a mouse. Median values are shown. ( t-test , * p -values < 0.05). g. Representative flow cytometry analysis of (CD19 + B220 lo CD5 + ) natural antibody producing B1a in the peritoneal cavity (PerC) of 1-year-old WT and Ftx KO females. Percentages in leucocytes are shown on the graphs beneath. Each triangle represents a mouse. Median values are shown. ( t-test , * p -values < 0.05). h. Cytokines levels in the blood analysed with CBA assays on sera from 3-month-, 1-year-, or 2-year-old WT and Ftx KO females. Each triangle represents a mouse. Median values are shown. ( t-test , * p -values < 0.05). i. Representative flow cytometry analysis of monocyte populations including non-classical (CD11b hi CD43 lo Ly6C + ) scavenger monocytes in the spleen of 1-year-old WT and Ftx KO females. Percentages in leucocytes are shown on the graphs beneath. Each triangle represents a mouse. Median values are shown. ( t-test , * p -values < 0.05).

Journal: bioRxiv

Article Title: Altered X-chromosome inactivation predisposes to autoimmune manifestations in mice

doi: 10.1101/2023.04.20.537662

Figure Lengend Snippet: a. Spleen weight of wild-type (WT) and Ftx KO females at 3-months, 1-year and 2-years of age. Median values are shown. ( t-test , * p -values < 0.05). Underneath, representative images of WT and Ftx KO spleens from 3-month, 1-year and 2-year-old females. b. Representative images of hematoxylin-eosin staining on sections of spleens from 1-year-old WT and Ftx KO females. Scale bar; 100 μm. c. Representative flow cytometry analysis of splenic myeloid dendritic cells (m-DC) in WT and Ftx KO 1-year-old females. On the right, percentages of splenic m-DC (CD11b + CD11c + ) and splenic plasmacytoid dendritic cells (p-DC) (CD11c + B220 + SiglecH + ) in leucocytes. Each triangle represents a mouse. Median values are shown. ( t-test , * p -values < 0.05). d. Representative flow cytometry analysis of spontaneously activated B cells (B220 + CD69 + ) (upper panels) or of spontaneously activated T cells (CD4 + CD69 + ) (lower panels) in spleen from 1-year-old WT and Ftx KO females. Percentages in leucocytes are shown on the graphs beneath. Each triangle represents a mouse. Median values are shown. ( t-test , * p -values < 0.05). e. IgG2a natural antibody levels in sera of 1-year- and 2-year-old WT or Ftx KO females measured by ELISA. Each triangle represents a mouse. Median values are shown. ( t-test , * p -values < 0.05). f. Representative flow cytometry analysis of (B220 + CD138 + ) plasma cells in the spleen of 1-year-old WT and Ftx KO females. Percentages in leucocytes are shown on the graphs beneath. Each triangle represents a mouse. Median values are shown. ( t-test , * p -values < 0.05). g. Representative flow cytometry analysis of (CD19 + B220 lo CD5 + ) natural antibody producing B1a in the peritoneal cavity (PerC) of 1-year-old WT and Ftx KO females. Percentages in leucocytes are shown on the graphs beneath. Each triangle represents a mouse. Median values are shown. ( t-test , * p -values < 0.05). h. Cytokines levels in the blood analysed with CBA assays on sera from 3-month-, 1-year-, or 2-year-old WT and Ftx KO females. Each triangle represents a mouse. Median values are shown. ( t-test , * p -values < 0.05). i. Representative flow cytometry analysis of monocyte populations including non-classical (CD11b hi CD43 lo Ly6C + ) scavenger monocytes in the spleen of 1-year-old WT and Ftx KO females. Percentages in leucocytes are shown on the graphs beneath. Each triangle represents a mouse. Median values are shown. ( t-test , * p -values < 0.05).

Article Snippet: Bone marrow, spleen, blood and peritoneal cavity cells were stained using the following antibodies: CD3 PerCP-Vio770 (130-119-656, Miltenyi Biotec), CD4-APC (130-123-207, Miltenyi Biotec), CD5-APC-Vio770 (130-120-165, Miltenyi Biotec), CD8-FITC (130-118-468, Miltenyi Biotec), CD11b APC (553312, BD Pharmingen), CD11c PE-Vio770 (130-110-840, Miltenyi Biotec), CD19-FITC (557398, BD Pharmingen), CD21-APC-Vio770 (130-111-733, Miltenyi Biotec), CD23-PE-Vio770 (130-118-764, Miltenyi Biotec), CD38-PE (130-123-571, Miltenyi Biotec), CD43-PE (130-112-887, Miltenyi Biotec), CD69-PE (130-115-575, Miltenyi Biotec), CD138 PE-Vio615 (130-108-989, Miltenyi Biotec), F4/80 FITC (130-117-509, Miltenyi Biotec), Ter119 PE (130-112-909, Miltenyi Biotec), SiglecH APC-Vio770 (130-112-299, Miltenyi Biotec), B220-APC (130-110-847, Miltenyi Biotec), B220 VioBlue (130-110-851, Miltenyi Biotec), IgM-VioBlue (130-116-318, Miltenyi Biotec), IgD-PE (130-111-496, Miltenyi Biotec), GL7-PE-Cy7 (144619, BioLegend), Ly6C-FITC (130-111-915, Miltenyi Biotec) following recommendations of the manufacturers.

Techniques: Staining, Flow Cytometry, Enzyme-linked Immunosorbent Assay, Clinical Proteomics

Figure 2. DM mice exhibit synaptic deficits and increased neuroinflammation in the HIP. (A) Repre- sentative WB images showing the expression levels of the presynaptic protein synapsin I (SYN1) and the postsynaptic protein postsynaptic density protein 95 (PSD95) in the HIP of CTL and DM mice. β-actin was used as an internal control. (B) Semi-quantitative analysis of PSD95 and SYN1 expression levels from immunoblot experiments. n = 6. (C) Representative images of Iba1 immunostaining in the HIP of CTL and DM mice. The area within the dashed box is magnified and displayed in the insets. Scale bars: 100 µm (main images) and 20 µm (insets). (D) Quantitative analysis of Iba1-positive microglia in the HIP of CTL and DM mice. n = 5. (E) qPCR analysis of iNOS and Arg1 mRNA levels in the HIP of CTL and DM mice. n = 6. (F) qPCR analysis of IL-6, IL-1β, and TNF-α mRNA levels in the HIP of CTL and DM mice. n = 6. (G) ELISA measuring IL-6, IL-1β, and TNF-α levels in the serum of CTL and DM mice. n = 3. Data are presented as mean ± SEM. Statistical significance was determined using a one-tailed unpaired t-test. * p < 0.05, ** p < 0.01, *** p < 0.001.

Journal: International Journal of Molecular Sciences

Article Title: Mesenchymal Stem Cells Restore Endothelial Integrity and Alleviate Emotional Impairments in a Diabetic Mouse Model via Inhibition of MMP-9 Activity

doi: 10.3390/ijms26073355

Figure Lengend Snippet: Figure 2. DM mice exhibit synaptic deficits and increased neuroinflammation in the HIP. (A) Repre- sentative WB images showing the expression levels of the presynaptic protein synapsin I (SYN1) and the postsynaptic protein postsynaptic density protein 95 (PSD95) in the HIP of CTL and DM mice. β-actin was used as an internal control. (B) Semi-quantitative analysis of PSD95 and SYN1 expression levels from immunoblot experiments. n = 6. (C) Representative images of Iba1 immunostaining in the HIP of CTL and DM mice. The area within the dashed box is magnified and displayed in the insets. Scale bars: 100 µm (main images) and 20 µm (insets). (D) Quantitative analysis of Iba1-positive microglia in the HIP of CTL and DM mice. n = 5. (E) qPCR analysis of iNOS and Arg1 mRNA levels in the HIP of CTL and DM mice. n = 6. (F) qPCR analysis of IL-6, IL-1β, and TNF-α mRNA levels in the HIP of CTL and DM mice. n = 6. (G) ELISA measuring IL-6, IL-1β, and TNF-α levels in the serum of CTL and DM mice. n = 3. Data are presented as mean ± SEM. Statistical significance was determined using a one-tailed unpaired t-test. * p < 0.05, ** p < 0.01, *** p < 0.001.

Article Snippet: The membranes were blocked and incubated overnight with the following antibodies: PSD95 (SYSN, Toronto, ON, Canada, 124002, 1:1000); SYN1 (SYSN, 106011, 1:1000); Cldn5 (Invitrogen, 35-2500, 1:1000); Ocln (Invitrogen, 71-1500, 1:1000); and MMP9 (Boster, Shanghai, China; PB9669, 1:1000).

Techniques: Expressing, Control, Western Blot, Immunostaining, Enzyme-linked Immunosorbent Assay, One-tailed Test

Figure 6. MSC treatment attenuated DM-induced neuroinflammation and synaptic deficits. (A) Representative immunofluorescence images of Iba1 staining in the HIP of mice from the CTL, MSC, DM, and DM+MSC groups. The dashed box indicates the magnified region shown in the insets. Scale bars: 100 µm (main images) and 20 µm (insets). (B) Quantitative analysis of Iba1+ microglia in the HIP. n = 4. (C) qPCR analysis of iNOS and Arg1 mRNA levels in the HIP of mice from the CTL, MSC, DM, and DM+MSC groups. n = 9. (D) qPCR analysis of mRNA levels of IL-6, IL-1β, and TNF-α in the HIP of mice from the CTL, MSC, DM, and DM+MSC groups. n = 9. (E) ELISA results showing serum levels of IL-6, IL-1β, and TNF-α in CTL, MSC, DM, and DM+MSC mice. n = 4. (F) Representative WB images of PSD95 and SYN1 expression in the HIP. β-actin was used as a loading control. (G) Semi-quantitative analysis of PSD95 and SYN1 protein levels. n = 6. Data are presented as mean ± SEM. Two-way ANOVA followed by Tukey’s post hoc test. ** p < 0.01, *** p < 0.001.

Journal: International Journal of Molecular Sciences

Article Title: Mesenchymal Stem Cells Restore Endothelial Integrity and Alleviate Emotional Impairments in a Diabetic Mouse Model via Inhibition of MMP-9 Activity

doi: 10.3390/ijms26073355

Figure Lengend Snippet: Figure 6. MSC treatment attenuated DM-induced neuroinflammation and synaptic deficits. (A) Representative immunofluorescence images of Iba1 staining in the HIP of mice from the CTL, MSC, DM, and DM+MSC groups. The dashed box indicates the magnified region shown in the insets. Scale bars: 100 µm (main images) and 20 µm (insets). (B) Quantitative analysis of Iba1+ microglia in the HIP. n = 4. (C) qPCR analysis of iNOS and Arg1 mRNA levels in the HIP of mice from the CTL, MSC, DM, and DM+MSC groups. n = 9. (D) qPCR analysis of mRNA levels of IL-6, IL-1β, and TNF-α in the HIP of mice from the CTL, MSC, DM, and DM+MSC groups. n = 9. (E) ELISA results showing serum levels of IL-6, IL-1β, and TNF-α in CTL, MSC, DM, and DM+MSC mice. n = 4. (F) Representative WB images of PSD95 and SYN1 expression in the HIP. β-actin was used as a loading control. (G) Semi-quantitative analysis of PSD95 and SYN1 protein levels. n = 6. Data are presented as mean ± SEM. Two-way ANOVA followed by Tukey’s post hoc test. ** p < 0.01, *** p < 0.001.

Article Snippet: The membranes were blocked and incubated overnight with the following antibodies: PSD95 (SYSN, Toronto, ON, Canada, 124002, 1:1000); SYN1 (SYSN, 106011, 1:1000); Cldn5 (Invitrogen, 35-2500, 1:1000); Ocln (Invitrogen, 71-1500, 1:1000); and MMP9 (Boster, Shanghai, China; PB9669, 1:1000).

Techniques: Immunofluorescence, Staining, Enzyme-linked Immunosorbent Assay, Expressing, Control

Fig. 1 Schematic representation of synuclein proteins (α, β, and γ-synuclein) illustrating their conserved and unique epitopes. The lower panel shows the results of the β-syn-targeting ELISAs: N-terminus assay (using an EP1537Y antibody for detection and N-terminus capture), mid-region assay (utilizing EP1537Y and ADx β-syn1 antibodies), and C-terminus assay (using EP1537Y for detection of ADx β-syn2 for capture). The placement of antibodies reflects their approximate binding sites on the β-syn protein. These in-house β-syn-specific assays offer targeted epitope recognition, enhancing the specificity of synaptic degeneration biomarker detection in AD. The exact binding epitopes of the antibodies are listed in the figure, starting with the first amino acid binding position and ending with the last amino acid

Journal: Alzheimer's research & therapy

Article Title: Novel CSF β-synuclein-specific assays signal early synaptic degeneration in Alzheimer's disease.

doi: 10.1186/s13195-025-01716-8

Figure Lengend Snippet: Fig. 1 Schematic representation of synuclein proteins (α, β, and γ-synuclein) illustrating their conserved and unique epitopes. The lower panel shows the results of the β-syn-targeting ELISAs: N-terminus assay (using an EP1537Y antibody for detection and N-terminus capture), mid-region assay (utilizing EP1537Y and ADx β-syn1 antibodies), and C-terminus assay (using EP1537Y for detection of ADx β-syn2 for capture). The placement of antibodies reflects their approximate binding sites on the β-syn protein. These in-house β-syn-specific assays offer targeted epitope recognition, enhancing the specificity of synaptic degeneration biomarker detection in AD. The exact binding epitopes of the antibodies are listed in the figure, starting with the first amino acid binding position and ending with the last amino acid

Article Snippet: Linear epitope mapping of two rabbit monoclonal antibodies, EP1537Y (Abcam, ab221908) and EP1646Y (Abcam, ab189217), and two mouse monoclonal antibodies, ADx β-syn1 and ADx β-syn2, was conducted using three libraries of overlapping synthetic peptides (BioSynth, Lelystadt, NL) [34].

Techniques: Binding Assay, Biomarker Discovery

Organotypic mouse hippocampal slice cultures as a model to study seeded α-syn aggregation in the region between DG and CA3. a Diagram showing the synaptic connections of granule cells of DG (where S129A PFFs were injected) to pyramidal neurons in CA3 that subsequently connect to the pyramidal neurons of the CA1 region. b OHSCs from mouse pups were cultivated on an air-liquid interface. c Progressive accumulation of total ( i ) and pS129-α-syn ( ii , 11A5) in cultures from wild type mouse pups after 0, 7, 14, and 21 DIV analyzed by immunoblotting. d Experimental flow showing time of PFF microinjection at 7 DIV and tissue collection for analysis at 3, 5, 7, and 14 dpi. e pS129-positive α-syn structures (D1R1R) imaged at DG, following PFF injection at DG. Aggregates are first recognizable at 3 dpi as short serpentine aggregates ( i ) that coalesce into longer aggregates by 5 dpi ( ii ) and at 7 dpi occur as fibrillar aggregates around neuronal nuclei ( iii ). Scale bars: 20 μm. f MJF-14-positive serpentine aggregates co-localize with the axonal marker neurofilament light chain (NF-L). Scale bar: 20 μm. g pS129-positive cell body inclusions (D1R1R) are located in NeuN-positive neurons. Scale bar: 20 μm, inset: 5 μm. h Thread-like cell body inclusion detected by MJF-14 and reconstructed in 3D by IMARIS software. i Cell body pS129 α-syn pathology (D1R1R) in the hindbrain of end-stage h-A53T-α-syn transgenic mice (M83) resembles inclusions in the slice model (panels e,iii & g ). j dSTORM image reconstruction of pS129-positive axonal processes (D1R1R) within the OHSC. Scale bar: 1 μm. k Progressive accumulation of insoluble pS129-positive mouse α-syn (11A5) in PFF-injected slices. Western blots in c & k are representative of 2–3 separate experiments. Images in e are examples from 2 to 6 individual experiments with 9–17 slices in total. Images in f & g are representative of 4–5 experiments/15–16 slices in total

Journal: Acta Neuropathologica Communications

Article Title: Organotypic slice culture model demonstrates inter-neuronal spreading of alpha-synuclein aggregates

doi: 10.1186/s40478-019-0865-5

Figure Lengend Snippet: Organotypic mouse hippocampal slice cultures as a model to study seeded α-syn aggregation in the region between DG and CA3. a Diagram showing the synaptic connections of granule cells of DG (where S129A PFFs were injected) to pyramidal neurons in CA3 that subsequently connect to the pyramidal neurons of the CA1 region. b OHSCs from mouse pups were cultivated on an air-liquid interface. c Progressive accumulation of total ( i ) and pS129-α-syn ( ii , 11A5) in cultures from wild type mouse pups after 0, 7, 14, and 21 DIV analyzed by immunoblotting. d Experimental flow showing time of PFF microinjection at 7 DIV and tissue collection for analysis at 3, 5, 7, and 14 dpi. e pS129-positive α-syn structures (D1R1R) imaged at DG, following PFF injection at DG. Aggregates are first recognizable at 3 dpi as short serpentine aggregates ( i ) that coalesce into longer aggregates by 5 dpi ( ii ) and at 7 dpi occur as fibrillar aggregates around neuronal nuclei ( iii ). Scale bars: 20 μm. f MJF-14-positive serpentine aggregates co-localize with the axonal marker neurofilament light chain (NF-L). Scale bar: 20 μm. g pS129-positive cell body inclusions (D1R1R) are located in NeuN-positive neurons. Scale bar: 20 μm, inset: 5 μm. h Thread-like cell body inclusion detected by MJF-14 and reconstructed in 3D by IMARIS software. i Cell body pS129 α-syn pathology (D1R1R) in the hindbrain of end-stage h-A53T-α-syn transgenic mice (M83) resembles inclusions in the slice model (panels e,iii & g ). j dSTORM image reconstruction of pS129-positive axonal processes (D1R1R) within the OHSC. Scale bar: 1 μm. k Progressive accumulation of insoluble pS129-positive mouse α-syn (11A5) in PFF-injected slices. Western blots in c & k are representative of 2–3 separate experiments. Images in e are examples from 2 to 6 individual experiments with 9–17 slices in total. Images in f & g are representative of 4–5 experiments/15–16 slices in total

Article Snippet: Antibodies used were the following: rabbit polyclonal anti-α-syn (ASY-1 1:1000) [ ], rabbit mAb anti-α-syn antibody (MJFR1 #ab138501, Abcam, 1:1000), mouse mAb pS129-α-syn (11A5, kindly provided by Imago Pharmaceuticals, 1:2000), mouse mAb anti-β-Tubulin III (TUJ1 #T8578, Sigma, 1:5000), rabbit mAb mouse-specific α-syn (D37A6 XP Rabbit #4179, Cell Signaling, 1:1000), mouse mAb anti-α-syn Syn-1 (Clone 42 #610787, BD Transduction Laboratories, 1:1000).

Techniques: Injection, Western Blot, Marker, Software, Transgenic Assay

Trans-synaptic spreading of α-syn aggregate pathology from DG via CA3 to the CA1 region depends on α-syn expression levels. a No aggregation is induced by injection of ( i ) monomeric α-syn in WT slices or ( ii ) S129A PFFs in α-syn KO slices. Scale bars: 20 μm. b Composite image of immunostaining for aggregated (MJF-14, green) and pS129-α-syn (11A5, red) 7 dpi in WT OHSCs, scale bar: 200 μm. Areas from DG, CA3, and CA1 regions indicated are magnified in panels i , ii , and iii . Scale bars: 20 μm. Axonal aggregates (arrows) are present in all three regions, while cell body inclusions (arrowheads) are present only in DG at 7 dpi. c Composite image of immunostaining with MJF-14 and pS129 for aggregates 7 dpi in ASO OHSCs. Scale bar: 200 μm. i , ii Extensive MJF-14- and pS129-positive aggregation and ( iii ) faster progression with development of cell body inclusions in the CA1 region. Scale bars: 20 μm. d Quantification of pS129-α-syn aggregate fluorescence signals in total slices from PFF-injected WT and ASO slices. Bars represent mean ± SD, n = 3. Unpaired Student’s T-test, p -value = 0.019. e Immunostaining with pS129 (11A5) and MJF-14 at CA1 region of WT slices 14 dpi of PFFs show more compacted, spherical cytoplasmic inclusions, resembling Lewy bodies. Scale bar: 5 μm. f Schematic presentation of progressive development of aggregation; from short into longer serpentine, axonal inclusions in DG regions, which spread to CA3 and CA1 regions. Cell body inclusions appear at later stages when axonal pathology is already established in the region. Images in a are illustrative of 2–3 individual experiments with 10–12 slices in total. Images in b are representative of 17 slices/6 experiments, while images in c represent 3 slices/1 experiment. For quantification in d , 3 slices were included per group

Journal: Acta Neuropathologica Communications

Article Title: Organotypic slice culture model demonstrates inter-neuronal spreading of alpha-synuclein aggregates

doi: 10.1186/s40478-019-0865-5

Figure Lengend Snippet: Trans-synaptic spreading of α-syn aggregate pathology from DG via CA3 to the CA1 region depends on α-syn expression levels. a No aggregation is induced by injection of ( i ) monomeric α-syn in WT slices or ( ii ) S129A PFFs in α-syn KO slices. Scale bars: 20 μm. b Composite image of immunostaining for aggregated (MJF-14, green) and pS129-α-syn (11A5, red) 7 dpi in WT OHSCs, scale bar: 200 μm. Areas from DG, CA3, and CA1 regions indicated are magnified in panels i , ii , and iii . Scale bars: 20 μm. Axonal aggregates (arrows) are present in all three regions, while cell body inclusions (arrowheads) are present only in DG at 7 dpi. c Composite image of immunostaining with MJF-14 and pS129 for aggregates 7 dpi in ASO OHSCs. Scale bar: 200 μm. i , ii Extensive MJF-14- and pS129-positive aggregation and ( iii ) faster progression with development of cell body inclusions in the CA1 region. Scale bars: 20 μm. d Quantification of pS129-α-syn aggregate fluorescence signals in total slices from PFF-injected WT and ASO slices. Bars represent mean ± SD, n = 3. Unpaired Student’s T-test, p -value = 0.019. e Immunostaining with pS129 (11A5) and MJF-14 at CA1 region of WT slices 14 dpi of PFFs show more compacted, spherical cytoplasmic inclusions, resembling Lewy bodies. Scale bar: 5 μm. f Schematic presentation of progressive development of aggregation; from short into longer serpentine, axonal inclusions in DG regions, which spread to CA3 and CA1 regions. Cell body inclusions appear at later stages when axonal pathology is already established in the region. Images in a are illustrative of 2–3 individual experiments with 10–12 slices in total. Images in b are representative of 17 slices/6 experiments, while images in c represent 3 slices/1 experiment. For quantification in d , 3 slices were included per group

Article Snippet: Antibodies used were the following: rabbit polyclonal anti-α-syn (ASY-1 1:1000) [ ], rabbit mAb anti-α-syn antibody (MJFR1 #ab138501, Abcam, 1:1000), mouse mAb pS129-α-syn (11A5, kindly provided by Imago Pharmaceuticals, 1:2000), mouse mAb anti-β-Tubulin III (TUJ1 #T8578, Sigma, 1:5000), rabbit mAb mouse-specific α-syn (D37A6 XP Rabbit #4179, Cell Signaling, 1:1000), mouse mAb anti-α-syn Syn-1 (Clone 42 #610787, BD Transduction Laboratories, 1:1000).

Techniques: Expressing, Injection, Immunostaining, Fluorescence

Application I. Demonstrating trans-synaptic spreading as a route for spreading of α-syn-aggregate pathology from DG via CA3 to the CA1 region using surgical and viral transgene methods. a Illustration of PFF injection in CA1 in WT OHSCs to test the efficiency of the retrograde route of spreading. 1 Composite image 14 dpi of S129A PFFs at CA1. Scale bar: 200 μm. MJF-14-positive aggregates are seen at the CA1 region ( i, ii ), but there is no spreading to DG ( iii) . Scale bar i & iii: 50 μm, ii: 20 μm. b Diagram showing transection of axonal projections between DG and CA3, which blocks spreading of α-syn aggregate pathology from DG to CA1. The surgical destruction of the tissue is demonstrated by the absence of nuclei ( 1 ), axonal marker NF-L ( 2 ), and MJF-14 staining ( 3 ). Scale bars: 200 μm. Magnified images from 3 show aggregates at DG ( i ) and proximal to the cut ( ii ), but not distal to the lesion ( ii, iii ). Scale bars: 50 μm. c Diagram showing expression of WT - α-syn in α-syn KO slices by AAV vectors injected in DG, CA3, and CA1. 1 α-syn expression in DG, CA3, and CA1 supports spreading of aggregated pS129 α-syn (11A5) to CA1 7 dpi of PFFs in DG, as seen from the magnified panels i - iiii . Scale bar: 200 μm, i & iiii: 20 μm, ii & iii: 10 μm. Note the strong AAV-dependent expression of pS129 in some neuronal nuclei. d Illustration of WT - α-syn expression in DG and CA1 only of α-syn KO slices. 1 Absence of α-syn expression in the CA3 abolishes spreading of aggregation to CA1 at 7 dpi. Scale bar: 200 μm. i, ii pS129-positive aggregates are detectable at DG. iii N o pS129-positive aggregates are found at the CA1 region. Iiii A few neurons show nuclear expression of pS129-α-syn at CA3. Scale bars: i: 20 μm, ii, iii & iiii: 10 μm. Data in a are illustrative of 12 slices divided over 3 experiments. Images in b are representative of 4 experiments with 18 slices in total, while c & d representative of 3 separate experiments/18–21 slices in total per condition

Journal: Acta Neuropathologica Communications

Article Title: Organotypic slice culture model demonstrates inter-neuronal spreading of alpha-synuclein aggregates

doi: 10.1186/s40478-019-0865-5

Figure Lengend Snippet: Application I. Demonstrating trans-synaptic spreading as a route for spreading of α-syn-aggregate pathology from DG via CA3 to the CA1 region using surgical and viral transgene methods. a Illustration of PFF injection in CA1 in WT OHSCs to test the efficiency of the retrograde route of spreading. 1 Composite image 14 dpi of S129A PFFs at CA1. Scale bar: 200 μm. MJF-14-positive aggregates are seen at the CA1 region ( i, ii ), but there is no spreading to DG ( iii) . Scale bar i & iii: 50 μm, ii: 20 μm. b Diagram showing transection of axonal projections between DG and CA3, which blocks spreading of α-syn aggregate pathology from DG to CA1. The surgical destruction of the tissue is demonstrated by the absence of nuclei ( 1 ), axonal marker NF-L ( 2 ), and MJF-14 staining ( 3 ). Scale bars: 200 μm. Magnified images from 3 show aggregates at DG ( i ) and proximal to the cut ( ii ), but not distal to the lesion ( ii, iii ). Scale bars: 50 μm. c Diagram showing expression of WT - α-syn in α-syn KO slices by AAV vectors injected in DG, CA3, and CA1. 1 α-syn expression in DG, CA3, and CA1 supports spreading of aggregated pS129 α-syn (11A5) to CA1 7 dpi of PFFs in DG, as seen from the magnified panels i - iiii . Scale bar: 200 μm, i & iiii: 20 μm, ii & iii: 10 μm. Note the strong AAV-dependent expression of pS129 in some neuronal nuclei. d Illustration of WT - α-syn expression in DG and CA1 only of α-syn KO slices. 1 Absence of α-syn expression in the CA3 abolishes spreading of aggregation to CA1 at 7 dpi. Scale bar: 200 μm. i, ii pS129-positive aggregates are detectable at DG. iii N o pS129-positive aggregates are found at the CA1 region. Iiii A few neurons show nuclear expression of pS129-α-syn at CA3. Scale bars: i: 20 μm, ii, iii & iiii: 10 μm. Data in a are illustrative of 12 slices divided over 3 experiments. Images in b are representative of 4 experiments with 18 slices in total, while c & d representative of 3 separate experiments/18–21 slices in total per condition

Article Snippet: Antibodies used were the following: rabbit polyclonal anti-α-syn (ASY-1 1:1000) [ ], rabbit mAb anti-α-syn antibody (MJFR1 #ab138501, Abcam, 1:1000), mouse mAb pS129-α-syn (11A5, kindly provided by Imago Pharmaceuticals, 1:2000), mouse mAb anti-β-Tubulin III (TUJ1 #T8578, Sigma, 1:5000), rabbit mAb mouse-specific α-syn (D37A6 XP Rabbit #4179, Cell Signaling, 1:1000), mouse mAb anti-α-syn Syn-1 (Clone 42 #610787, BD Transduction Laboratories, 1:1000).

Techniques: Injection, Marker, Staining, Expressing

Application II. Demonstrating that phosphorylation of S129 on α-syn is not a prerequisite for seeding α-syn aggregation or trans-synaptic spreading in hippocampal slices. a Experimental setup with establishment of neuronal expression of either WT- or non-phosphorylatable S129G-α-syn in α-syn KO slices prior to initiation of templated α-syn aggregation by injection of S129A PFFs. b Validation of virally mediated WT- and non-phosphorylatable S129G-α-syn expression in α-syn KO slices using antibodies against total and pS129-α-syn (11A5). c Expression of WT α-syn supports establishment of MJF-14- and pS129-positive (11A5) aggregate pathology in the DG region following PFF injection at DG. Magnified panels show axonal aggregates ( i ) and cell body inclusions ( ii ) at DG. Scale bar: 50 μm, i : 20 μm, ii : 5 μm. d MJF-14- and pS129 positive (11A5) pathology spreads to the CA1 region within 7 dpi. Scale bar: 50 μm. e Expression of S129G-α-syn supports establishment of MJF-14-positive/pS129-negative aggregate pathology in the DG, present in axons ( i , arrows) and cell bodies ( i , arrowheads). Scale bar: 50 μm, i : 20 μm. f The non-phosphorylated MJF-14-positive aggregate pathology spreads to the CA1 region within 7 dpi. Scale bar: 50 μm. Western blot in b is representative of 3 independent experiments, while images in c - f are illustrative of 3–5 experiments with 21–30 slices in total per condition

Journal: Acta Neuropathologica Communications

Article Title: Organotypic slice culture model demonstrates inter-neuronal spreading of alpha-synuclein aggregates

doi: 10.1186/s40478-019-0865-5

Figure Lengend Snippet: Application II. Demonstrating that phosphorylation of S129 on α-syn is not a prerequisite for seeding α-syn aggregation or trans-synaptic spreading in hippocampal slices. a Experimental setup with establishment of neuronal expression of either WT- or non-phosphorylatable S129G-α-syn in α-syn KO slices prior to initiation of templated α-syn aggregation by injection of S129A PFFs. b Validation of virally mediated WT- and non-phosphorylatable S129G-α-syn expression in α-syn KO slices using antibodies against total and pS129-α-syn (11A5). c Expression of WT α-syn supports establishment of MJF-14- and pS129-positive (11A5) aggregate pathology in the DG region following PFF injection at DG. Magnified panels show axonal aggregates ( i ) and cell body inclusions ( ii ) at DG. Scale bar: 50 μm, i : 20 μm, ii : 5 μm. d MJF-14- and pS129 positive (11A5) pathology spreads to the CA1 region within 7 dpi. Scale bar: 50 μm. e Expression of S129G-α-syn supports establishment of MJF-14-positive/pS129-negative aggregate pathology in the DG, present in axons ( i , arrows) and cell bodies ( i , arrowheads). Scale bar: 50 μm, i : 20 μm. f The non-phosphorylated MJF-14-positive aggregate pathology spreads to the CA1 region within 7 dpi. Scale bar: 50 μm. Western blot in b is representative of 3 independent experiments, while images in c - f are illustrative of 3–5 experiments with 21–30 slices in total per condition

Article Snippet: Antibodies used were the following: rabbit polyclonal anti-α-syn (ASY-1 1:1000) [ ], rabbit mAb anti-α-syn antibody (MJFR1 #ab138501, Abcam, 1:1000), mouse mAb pS129-α-syn (11A5, kindly provided by Imago Pharmaceuticals, 1:2000), mouse mAb anti-β-Tubulin III (TUJ1 #T8578, Sigma, 1:5000), rabbit mAb mouse-specific α-syn (D37A6 XP Rabbit #4179, Cell Signaling, 1:1000), mouse mAb anti-α-syn Syn-1 (Clone 42 #610787, BD Transduction Laboratories, 1:1000).

Techniques: Expressing, Injection, Western Blot